CANOPY
Interaction Design
JavaScript
Data Visualization
TIME
Spring 2023 (4 Weeks)
CLASS
Core 2: Interaction with Beatriz Lozano and Patrick Morrisey
LINKS
Website︎︎︎
Interaction Design
JavaScript
Data Visualization
TIME
Spring 2023 (4 Weeks)
CLASS
Core 2: Interaction with Beatriz Lozano and Patrick Morrisey
LINKS
Website︎︎︎
Indigenous ecologies play an important role in an urban landscape. The 2015 NYCDPR Street Tree Census counted 666,314 trees citywide. However, an alarming 54% of these are non-native. The modern obsession for perfectly manicured green spaces is increasing and, in that process, harming most species living in that landscape. For example, the vast lawns in the city created a green monoculture carpet which no longer supports functioning ecosystems.
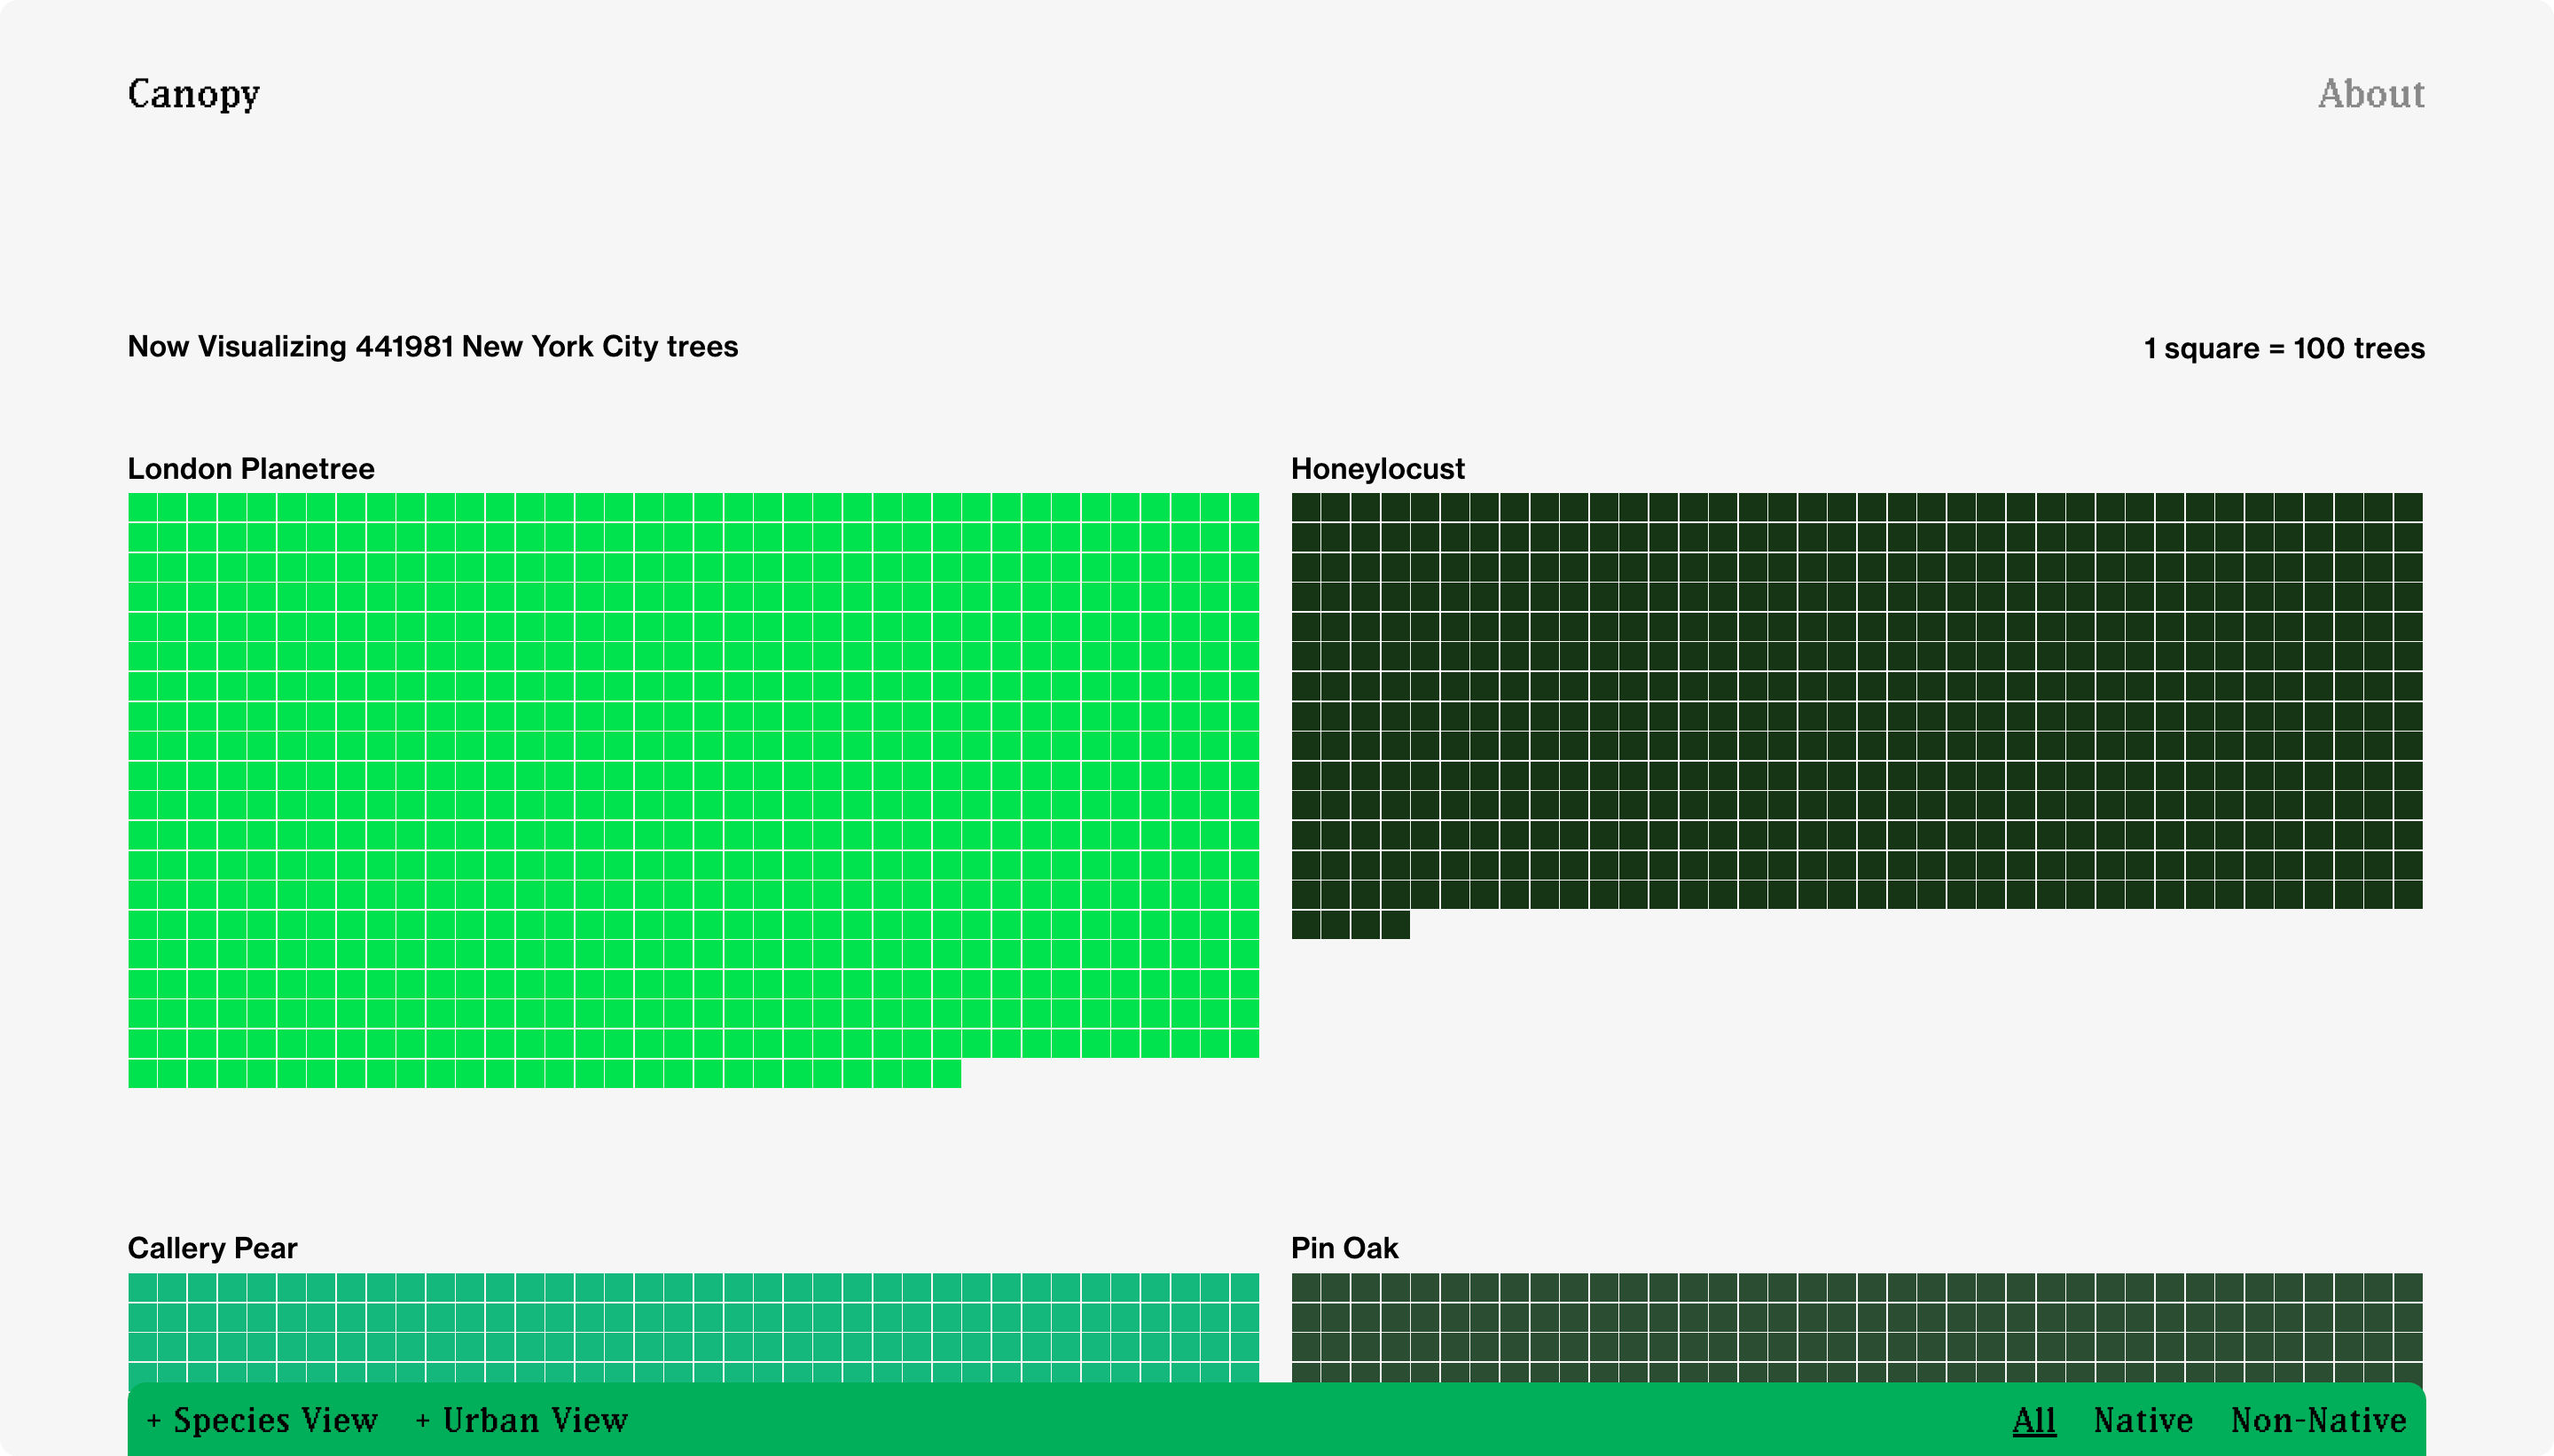
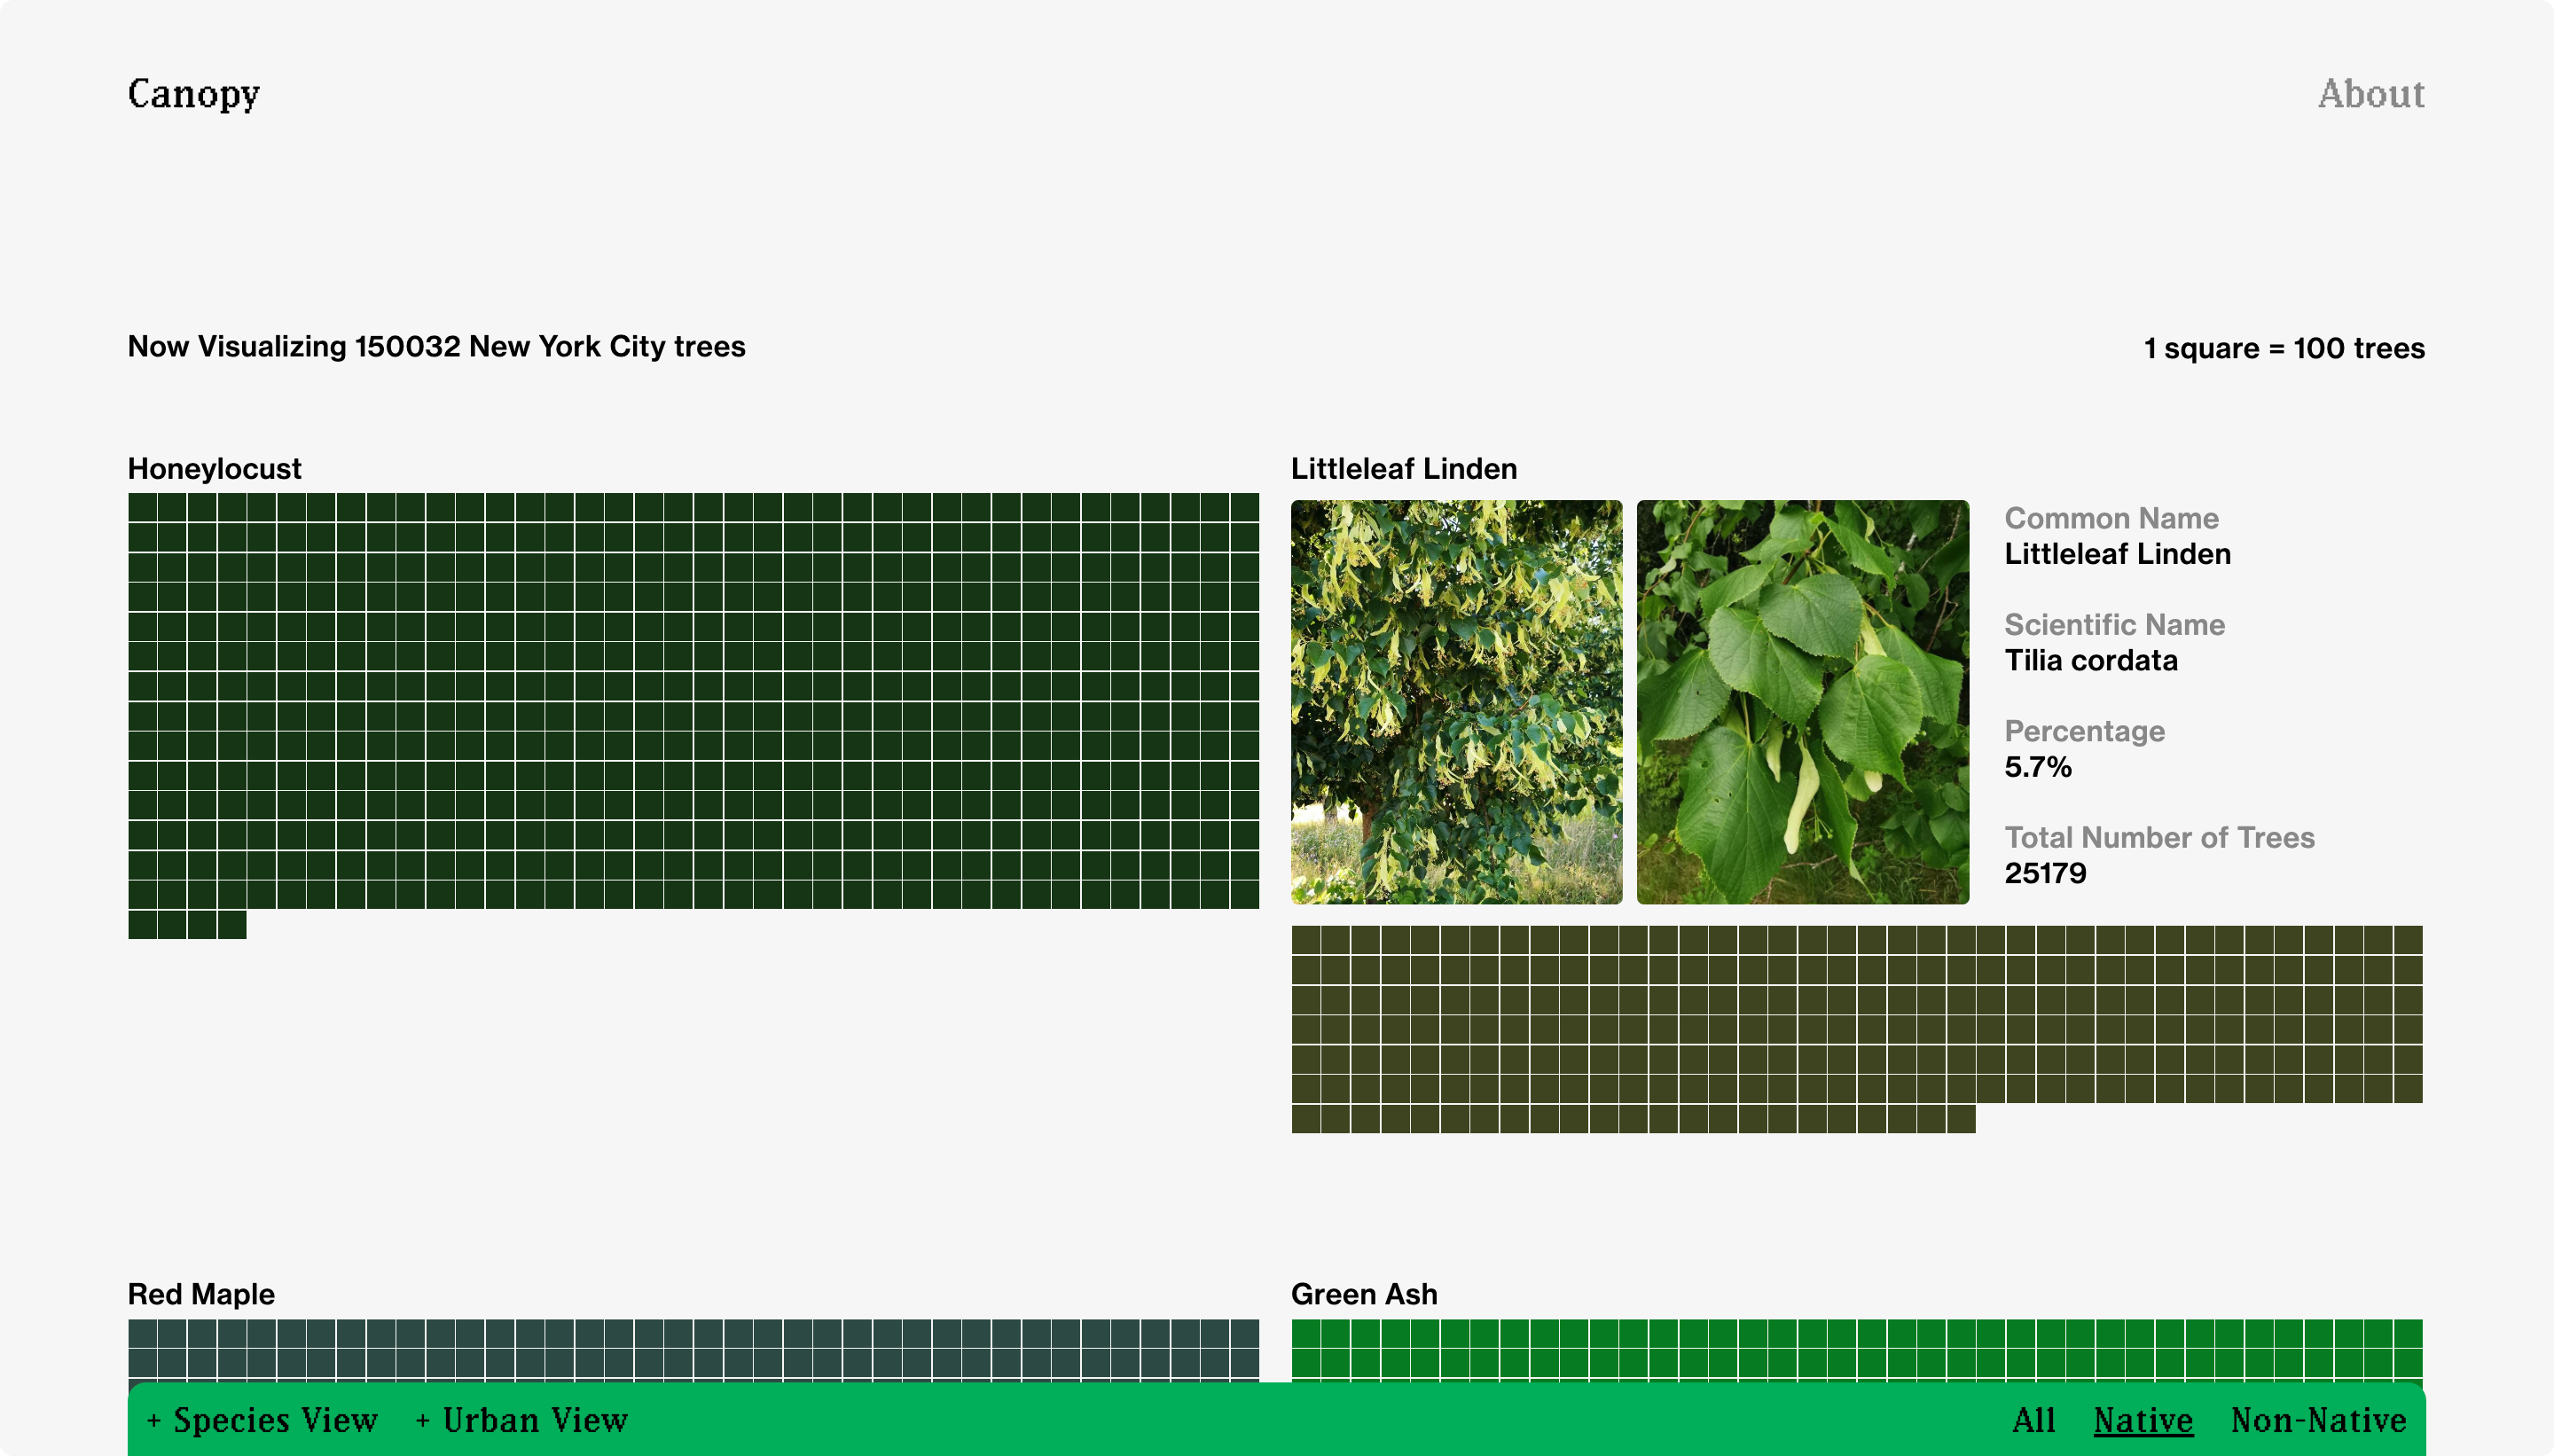
Canopy is a website that aims to visualise this alarming, asymmetric ratio from NYC Open Data’s Street Tree Census. The visual language for this website has been derived from satellite imagery and cropland photos. Jarring, digitized colors have been used for the perfectly manicured non-native trees of New York. In contrast, native species are denoted by murkier, earthier colors closer to their average mass tone.
Canopy is a website that aims to visualise this alarming, asymmetric ratio from NYC Open Data’s Street Tree Census. The visual language for this website has been derived from satellite imagery and cropland photos. Jarring, digitized colors have been used for the perfectly manicured non-native trees of New York. In contrast, native species are denoted by murkier, earthier colors closer to their average mass tone.
⚠️️ Warning: Dataset pulls in ~3 million datapoints. Site takes 30s to load but it does load. Working on a faster solution!
Visual inspiration: Croplands and Satellite Imagery ︎︎︎


Landing page generates a new “canopy” upon reload ︎︎︎
Individual Species View ︎︎︎

Urban View ︎︎︎


📌️ REFLECTION + NEXT STEPS
1. Better initial consideration of JSON data structure and pre-processing
Data wrangling, knowledge of data structures, and the internet is important! Intentionally choosing an appropriate data structure for my dataset (currently a super array of species arrays) would’ve saved me a lot of trouble, memory, and processing power. I hope to revise my initial pre-processing to make the site load faster.
2. Balancing delightful interaction vs creating a socially responsible site
At the moment, Canopy definitely visualizes street tree data in a unique way, as was mandated by our assignment brief (I hope!). However, the editorial lens I attempted to capture from the dataset was comparing the imbalanced native to non-native ratio of street trees. This can be pushed further still through unexpected interactions to create a more socially responsible, impactful site. Maybe this looks like visualising a subjective comparison between the environment impact of a native tree vs a non-native tree.
3. User testing website features at current fidelity
I received constant feedback from professors and peers throughout the creation of this website. From this point on though, I hope to directly user test the website at its current fidelity. It would be very useful to understand pain points and if the different site functionalities are translating as intended (Does a user even understand what this is all about? How do I improve this?). This came with the realisation that different design subfields (branding, interaction, data visualisation, coding, user experience) are perhaps not as disparate as I initially assumed. Working on marrying all of these together seems to produce the best output.